https://www.r-bloggers.com/recent-r-data-packages/
понеділок, 13 листопада 2017 р.

Mapping Learning
https://medium.com/data-analytics-and-coding/mapping-learner-experience-with-a-sphere-of-possibilities-ee9ad4c2bedd
Online Magazines
https://www.kdnuggets.com/2017/10/6-books-every-data-scientist-should-keep-nearby.html
четвер, 5 січня 2017 р.
Набор данных во временной ряд
For bi-monthly points of data:
b12=ts(m1[,15],start=2013,end=c(2016,6),frequency=6)
For monthly points of data:
b6=ts(dv,start=2013,end=c(2016,12),frequency=12)
For unfinished last year:
b5=ts(m1[,15],start=2013,end=c(2016,5),frequency=6)
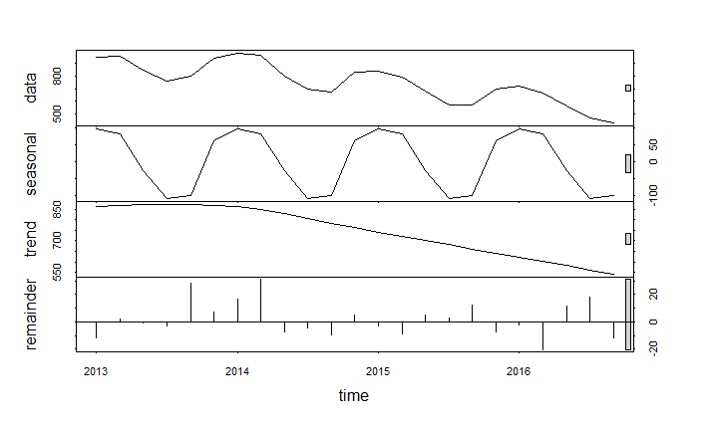
Find trend and variations:
bstl=stl(b5,s.window="periodic")
plot(bstl)

b12=ts(m1[,15],start=2013,end=c(2016,6),frequency=6)
For monthly points of data:
b6=ts(dv,start=2013,end=c(2016,12),frequency=12)
For unfinished last year:
b5=ts(m1[,15],start=2013,end=c(2016,5),frequency=6)
Find trend and variations:
bstl=stl(b5,s.window="periodic")
plot(bstl)
Підписатися на:
Дописи (Atom)